As a data enthusiast, you must be familiar with the power of SQL (Structured Query Language) for managing and manipulating relational databases.
But what’s better than combining the prowess of SQL with the visualization capabilities of popular BI tools like Tableau and Power BI? 
In this blog post, we’ll dive into the world of SQL and data visualization, exploring how to integrate SQL with Tableau, Power BI, and other popular visualization tools. So, buckle up and get ready to elevate your data game!
SQL in a Nutshell
For those unfamiliar, SQL is a domain-specific language designed for managing relational databases.
It’s been around since the 1970s and remains the go-to language for querying, updating, and modifying data stored in databases.
SQL allows you to perform CRUD (Create, Read, Update, and Delete) operations and more, enabling you to extract valuable insights from your data.
The Power of Data Visualization
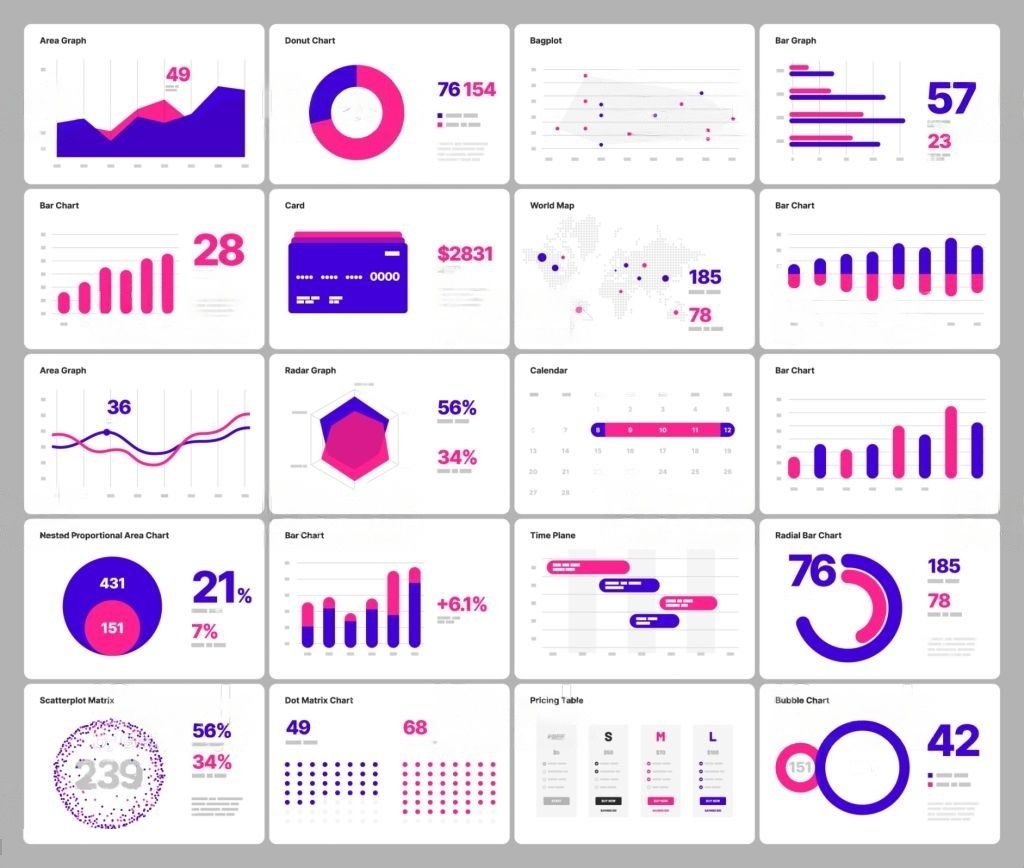
Data visualization is the representation of data in a visual format, such as charts, graphs, and maps.
It plays a critical role in helping people understand complex data by displaying it in a more comprehensible and engaging way.
Popular BI tools like Tableau, Power BI, and Looker have become indispensable for businesses worldwide, as they offer a wide range of visualization options and a user-friendly interface.
Integrating SQL with Tableau
Tableau is a powerful data visualization tool that allows you to create stunning visualizations with a simple drag-and-drop interface. But did you know you can also harness the power of SQL within Tableau? Here’s how:
- Connect to your database: Start by connecting Tableau to your database (e.g., MySQL, SQL Server, PostgreSQL). Tableau has native connectors for many popular databases, making the process seamless.
- Write custom SQL queries: Once connected, you can use Tableau’s Custom SQL option to write your own SQL queries and fetch the data you need for your visualizations. Simply navigate to the Data Source tab and click on “Custom SQL” to get started.
- Build your visualizations: With your data fetched using SQL, you can now create interactive and dynamic visualizations in Tableau. It’s as simple as dragging and dropping dimensions and measures onto the canvas!
Integrating SQL with Power BI
Power BI is another popular data visualization tool that offers robust integration with SQL databases. Here’s how to connect Power BI to your SQL database and start creating visualizations:
- Connect to your database: In Power BI, navigate to the Home tab and click on “Get Data.” Select your database type (e.g., SQL Server, MySQL) and enter your connection details.
- Write custom SQL queries: Once connected, you can use Power BI’s Advanced Query Editor to write custom SQL queries and fetch the data needed for your visualizations. Navigate to the Power Query Editor, click on “Advanced Editor,” and enter your SQL query.
- Build your visualizations: With your data fetched using SQL, start creating interactive and dynamic visualizations in Power BI by dragging and dropping fields onto the canvas.
Summary
Integrating SQL with data visualization tools like Tableau and Power BI empowers you to unlock the full potential of your data.
By leveraging the flexibility of SQL queries and the visual capabilities of these BI tools, you can create interactive, engaging, and insightful visualizations that drive data-driven decision-making.
So, go ahead and explore the world of SQL and data visualization, and take your data analysis skills to new heights!
Thank you for reading our blog, we hope you found the information provided helpful and informative. We invite you to follow and share this blog with your colleagues and friends if you found it useful.
Share your thoughts and ideas in the comments below. To get in touch with us, please send an email to dataspaceconsulting@gmail.com or contactus@dataspacein.com.
You can also visit our website – DataspaceAI


